Introduction
I released ruviz, a plotting library that tries to bring matplotlib-like ergonomics and Makie-style performance ambitions into Rust, while also making the same rendering engine callable from Rust, Python, and JavaScript.
- crates.io: ruviz
- PyPI: ruviz
- npm: ruviz
- GitHub: Ameyanagi/ruviz
- docs.rs: ruviz
- GPUI adapter: ruviz-gpui
- Portfolio: ruviz, ruviz-gpui, ruviz-web, ruviz Python
As of this post, the current release is 0.4.16 across the Rust crate, Python package, npm package, and GPUI adapter. It is still in early development, so APIs may change, but the core idea is already working: a single Rust renderer can serve native Rust code, Python notebooks, and browser WASM.
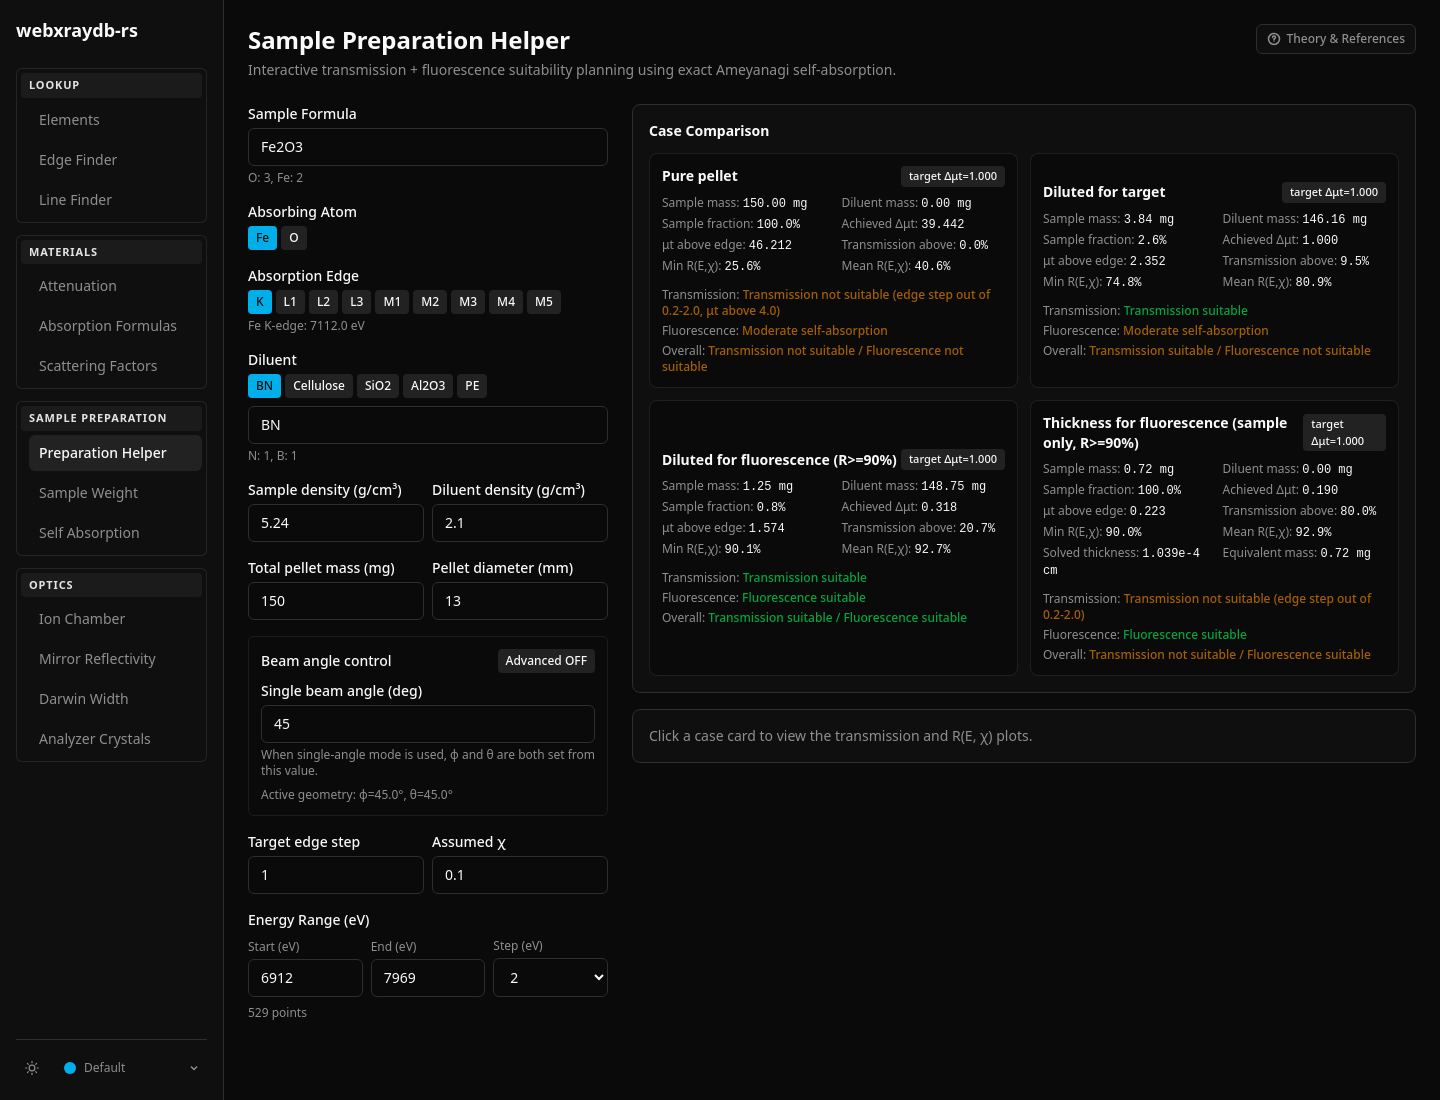
 A ruviz plot rendered with the publication theme.
Why I Built It
I have been working on xraytsubaki, a Rust project that reimplements core XAFS / XANES / EXAFS analysis features from Python's xraylarch.
When I started, Rust had plotting options, but I could not find a library that gave me publication-grade figures with a small amount of code.
| Library | Approach | Gap I felt |
|---|---|---|
| plotters | Low-level drawing API | Powerful and proven, but axes, legends, typography, and layout require a lot of explicit tuning |
| plotly.rs | Rust API for Plotly | Good for web-style interactivity, but static export and interactive rendering feel like separate workflows |
| plotpy | Python / matplotlib integration | Useful, but the workflow still depends on Python rather than being Rust-native end to end |
plotters is a strong foundation, but its layer is intentionally low. For research figures, "I can draw it" is not enough. I need axes, labels, legends, fonts, DPI, margins, and export formats to land in a shape that can go directly into a paper or conference deck.
The library I wanted had three goals:
- A concise API like matplotlib / seaborn
- High performance and reactive updates inspired by Makie.jl
- One rendering foundation for Rust, Python, Jupyter, and browsers
That became ruviz.
A Small Fluent API
The main entry point is a fluent Plot::new() builder. A simple line plot stays simple.
use ruviz::prelude::*;

fn main() -> Result<()> {
    let x: Vec<f64> = (0..100).map(|i| i as f64 * 0.1).collect();
    let y: Vec<f64> = x.iter().map(|&v| v.sin()).collect();

    Plot::new()
        .line(&x, &y)
        .title("Sine Wave")
        .xlabel("x")
        .ylabel("sin(x)")
        .save("sine.png")?;

    Ok(())
}
Multiple series, legends, and themes follow the same chain.
use ruviz::prelude::*;

fn main() -> Result<()> {
    let x = vec![0.0, 1.0, 2.0, 3.0, 4.0];
    let linear = x.clone();
    let quadratic: Vec<f64> = x.iter().map(|&v| v * v).collect();

    Plot::new()
        .line(&x, &linear)
        .label("Linear")
        .line(&x, &quadratic)
        .label("Quadratic")
        .legend(Position::TopLeft)
        .theme(Theme::publication())
        .save("series.png")?;

    Ok(())
}
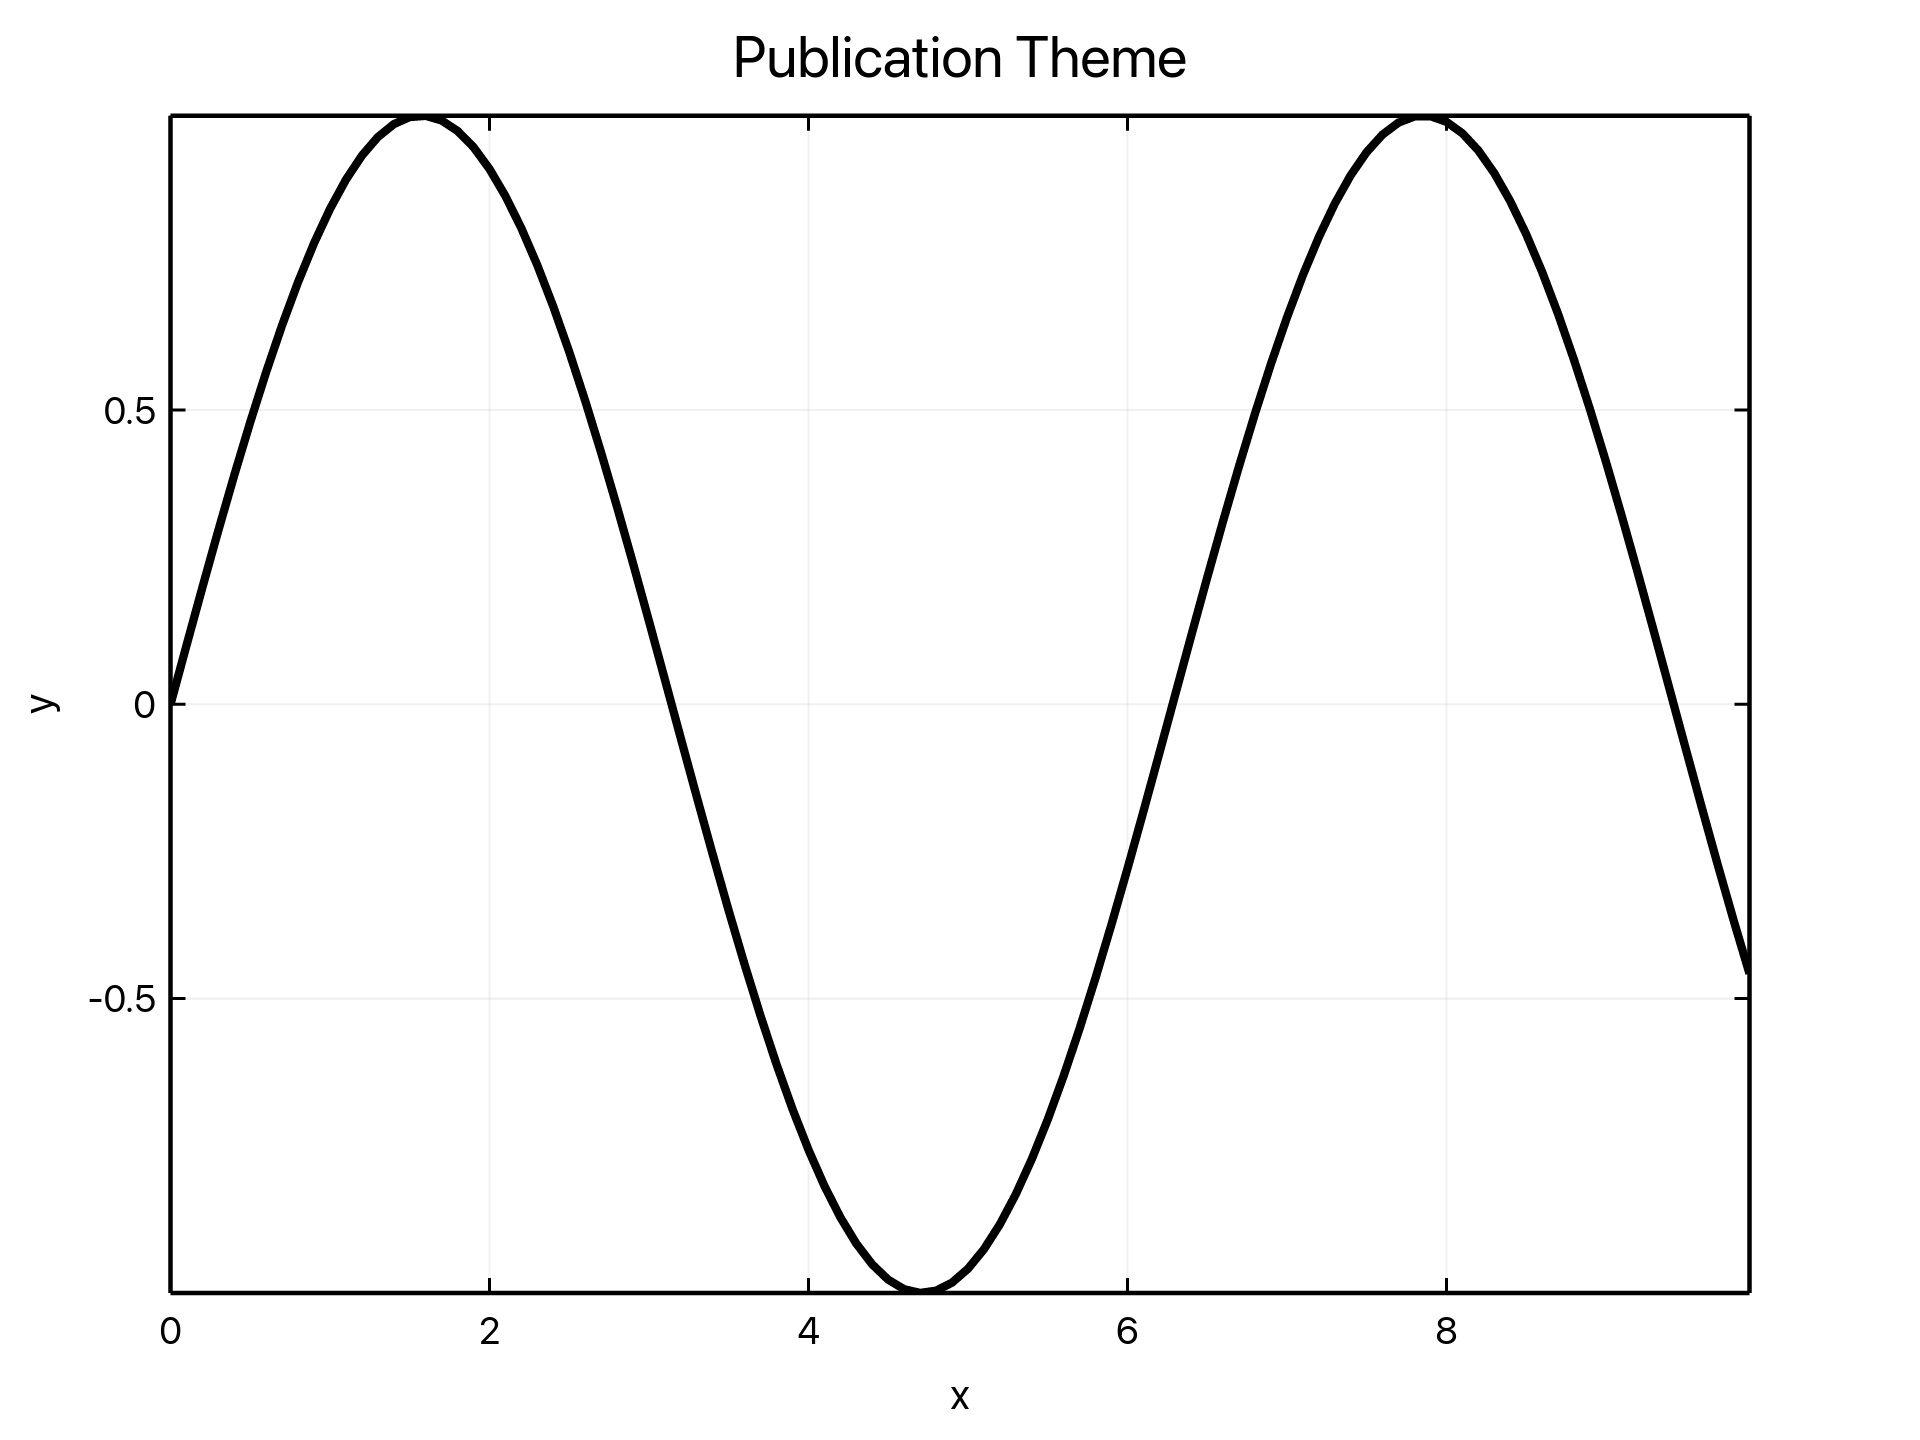
 The basic output example used in the ruviz README.
The high-level builder currently covers line, scatter, bar, histogram, boxplot, heatmap, KDE, ECDF, violin, pie, radar, polar line, contour, and error bars. It also supports layout helpers such as subplots, annotations, legends, grid/tick controls, and insets.
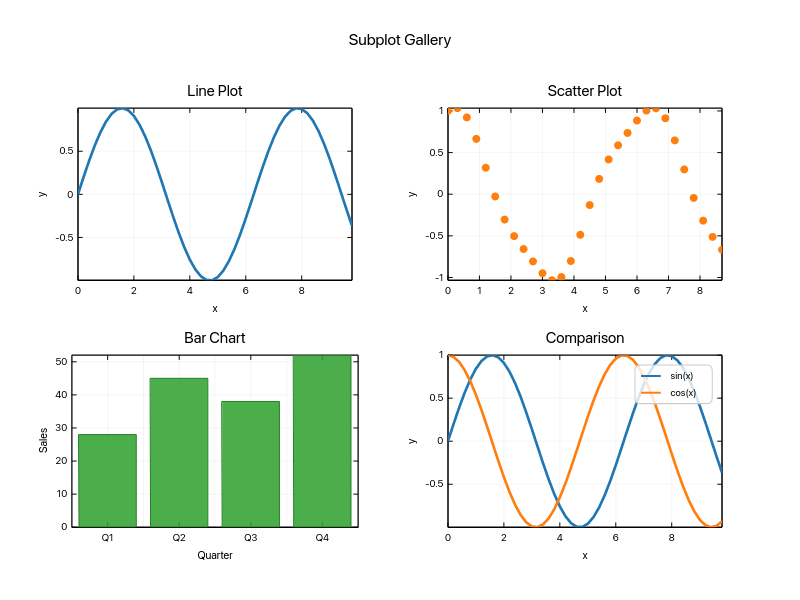 Subplot output generated by ruviz.
One Renderer Across Rust, Python, and JavaScript
This is the main design point.
In the Python ecosystem, notebook interactivity and static export often end up using different rendering paths. If you switch from matplotlib to Plotly, you get an even larger split. The figure you explore in a notebook and the figure you export for a paper can easily become two slightly different things.
ruviz keeps the core in Rust and exposes thin language bindings around it.
| Caller | Integration | Use case |
|---|---|---|
| Rust | Native crate | CLI tools, analysis pipelines, batch PNG/SVG/PDF export |
| Python | PyO3 + maturin | NumPy, pandas, Polars, Jupyter widgets |
| JavaScript | wasm32 + npm package | Browser apps, Vite apps, WASM canvas rendering |
| Desktop UI | ruviz-gpui | Native GPUI application embedding |
The goal is that a PNG saved from Rust, a widget shown in a Python notebook, and a browser canvas embedded in a dashboard all go through the same drawing core. Different frontends should not imply different plots.
A Working WASM Example
The demo below is a real ruviz WASM example embedded in this blog post. It uses the actual [email protected] npm package files, vendored with this site, and renders the plot inside the browser.
Move the slider and the plot updates an ObservableSeries without reconstructing the whole plot object. The PNG and SVG buttons export from the browser session.
The core of the demo looks like this:
import {
  createCanvasSession,
  createObservable,
  createPlot,
} from "ruviz";

const canvas = document.querySelector("canvas")!;
const x = Array.from({ length: 240 }, (_, i) => (i / 239) * 12);
const y = createObservable(x.map((value) => Math.sin(value)));

const plot = createPlot()
  .setSizePx(900, 520)
  .setTheme("light")
  .setTitle("ruviz reactive WASM plot")
  .setXLabel("x")
  .setYLabel("sin(x + phase)")
  .addLine({ x, y });

const session = await createCanvasSession(canvas, {
  backendPreference: "auto",
  bindInput: true,
});

await session.setPlot(plot);
session.render();

// Later, from a slider:
y.replace(x.map((value) => Math.sin(value + phase)));
session.render();
Being able to take a native Rust plotting engine and run it as a browser component is one of the reasons Rust is attractive for visualization infrastructure.
Python and Jupyter
The Python package is published on PyPI.
pip install ruviz
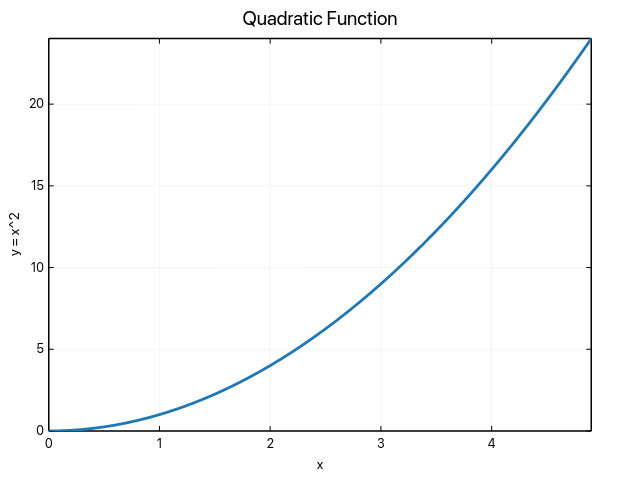
You can pass NumPy arrays directly and write code that stays close to the Rust builder style.
import numpy as np
import ruviz

x = np.linspace(0.0, 4.0, 50)
y = x**2

(
    ruviz.plot()
    .line(x, y)
    .title("Quadratic")
    .xlabel("x")
    .ylabel("y = x^2")
    .save("quadratic.png")
)
For pandas and Polars inputs:
pip install "ruviz[dataframes]"
In Jupyter, plot.show() displays static output, while plot.widget() gives you the WASM-backed widget. The intended flow is: analyze data in Python, interact with the same plot in a notebook/browser, then export through the same rendering path.
Publication-Grade Output
ruviz is designed around research and presentation figures from the start.
- PNG / SVG / PDF export (
pdffeature for PDF) - 72 / 96 / 300 / 600 DPI output
- Typst-backed math text (
typst-mathfeature) - UTF-8 labels, including CJK text
- subplots, legends, grids, ticks, annotations, and insets
parallel,simd, andgpufeature flags
International text matters for my own work, so CJK labels are part of the test surface rather than an afterthought.
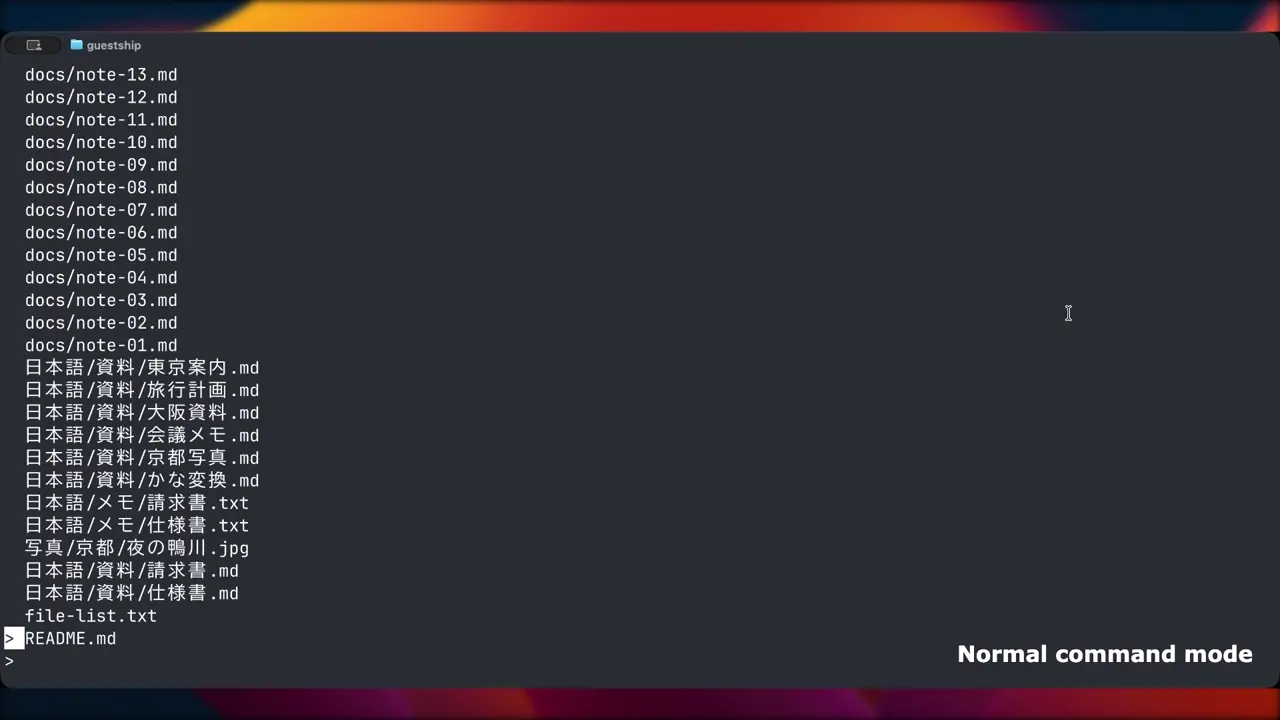
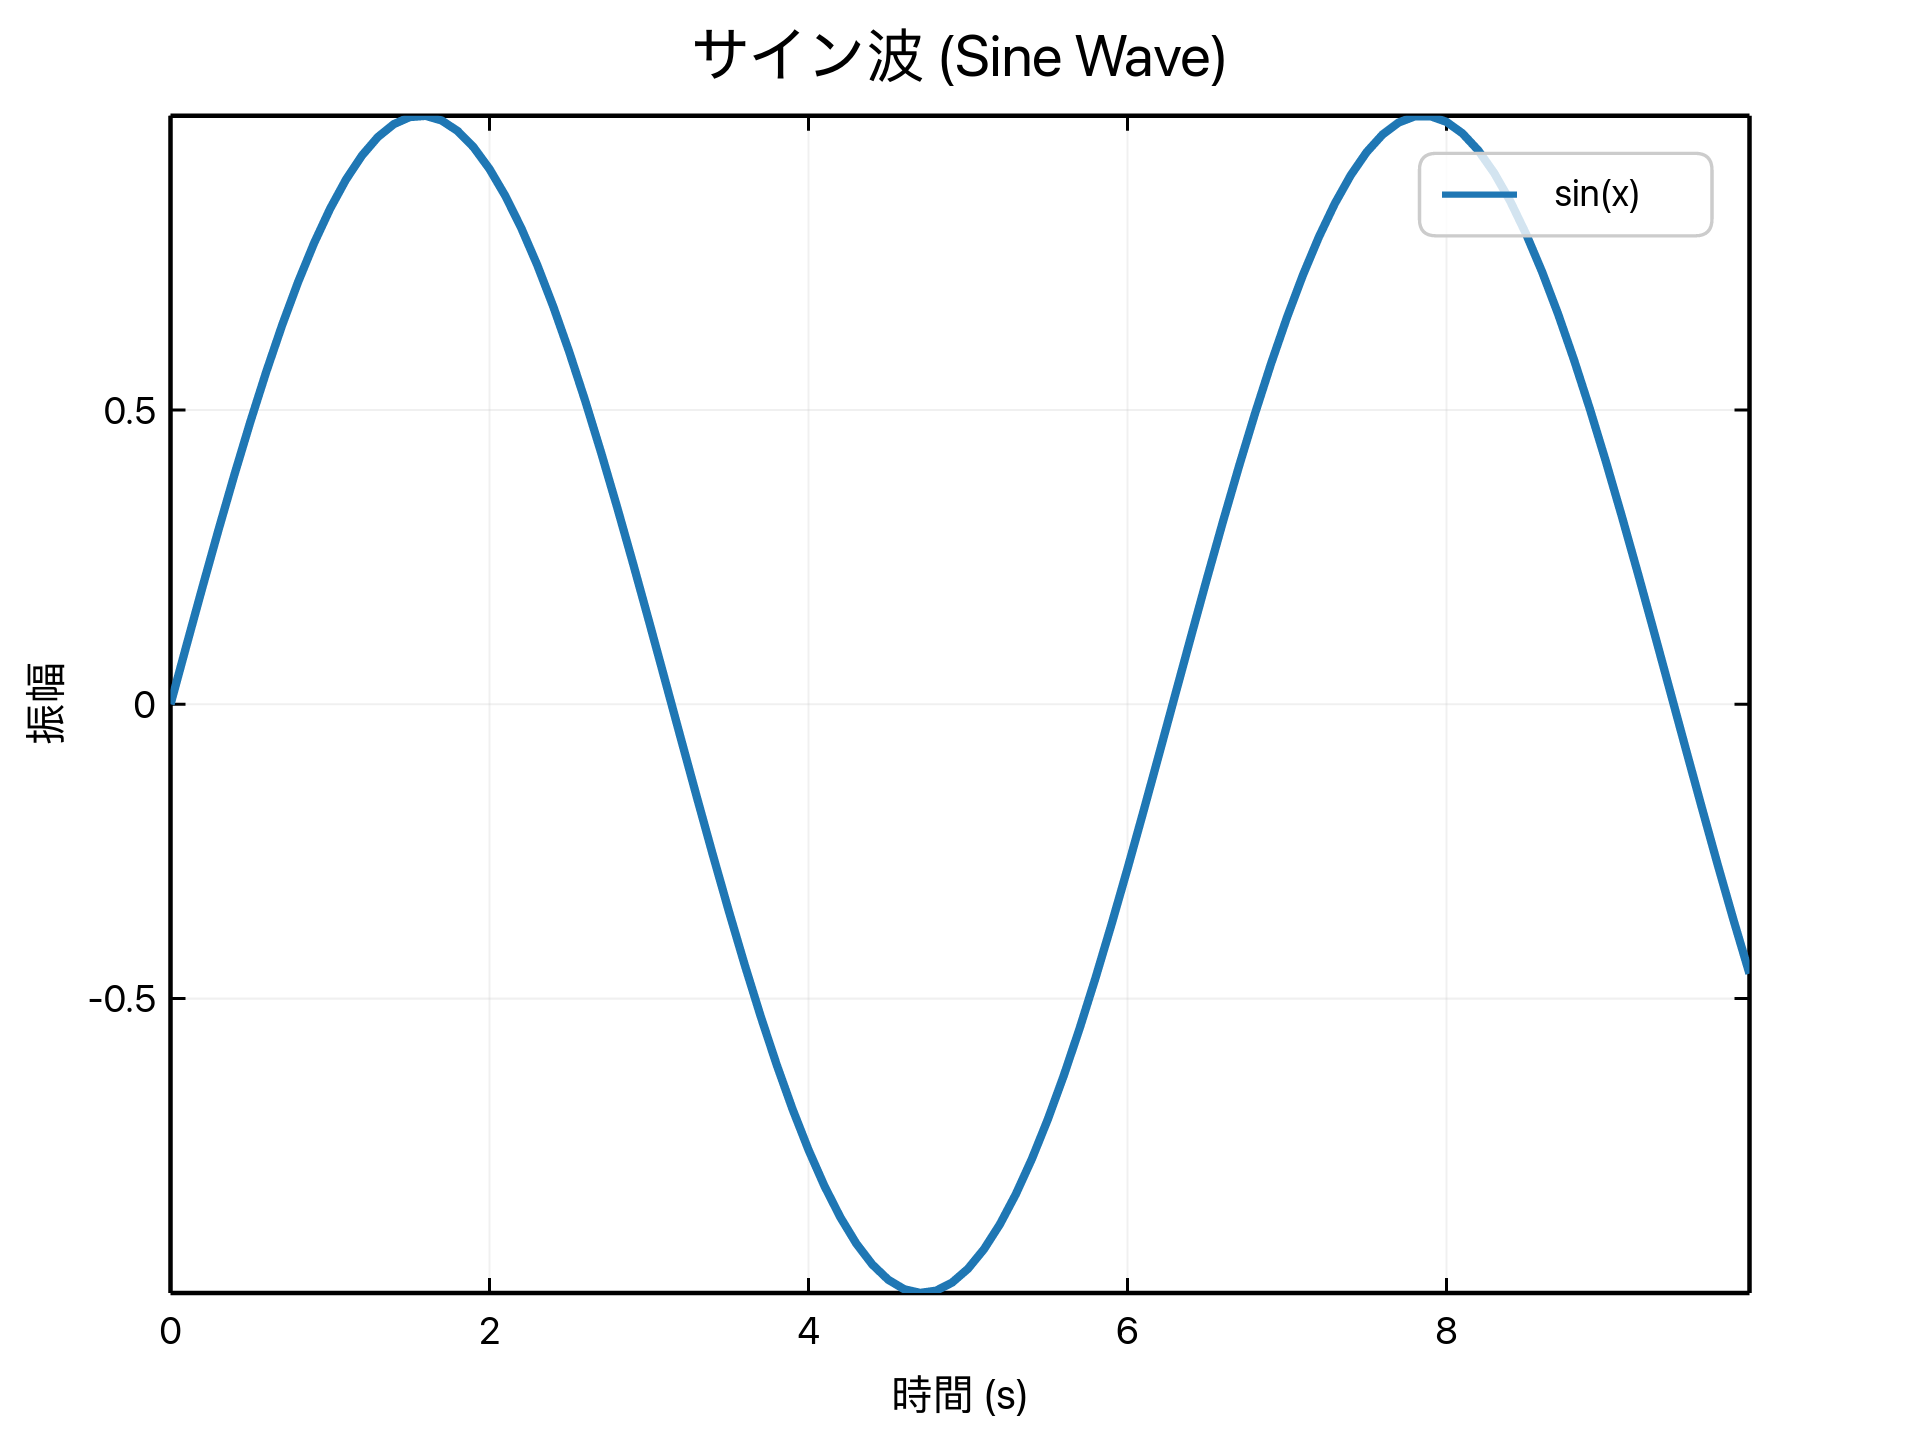 A ruviz internationalization demo with Japanese labels.
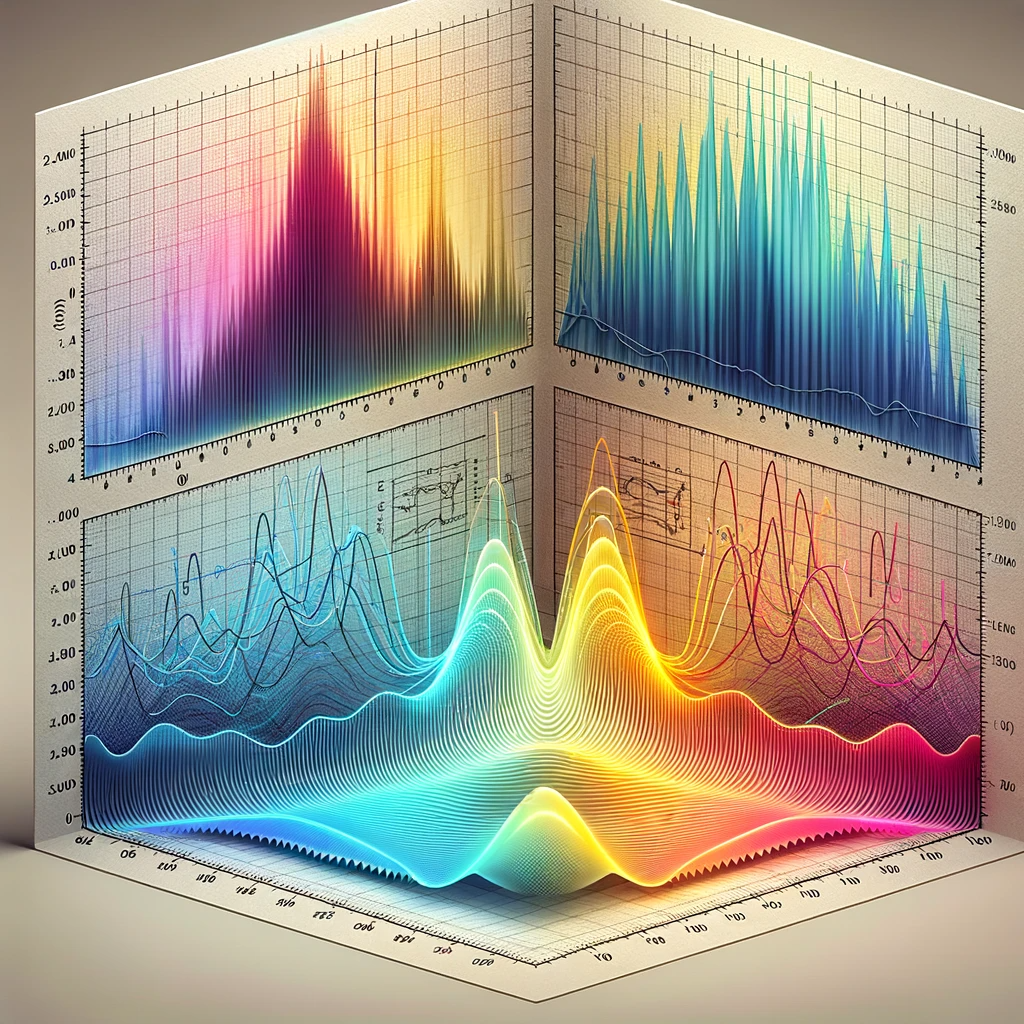
Large datasets are also part of the target use case. The image below comes from the repository's performance gallery.
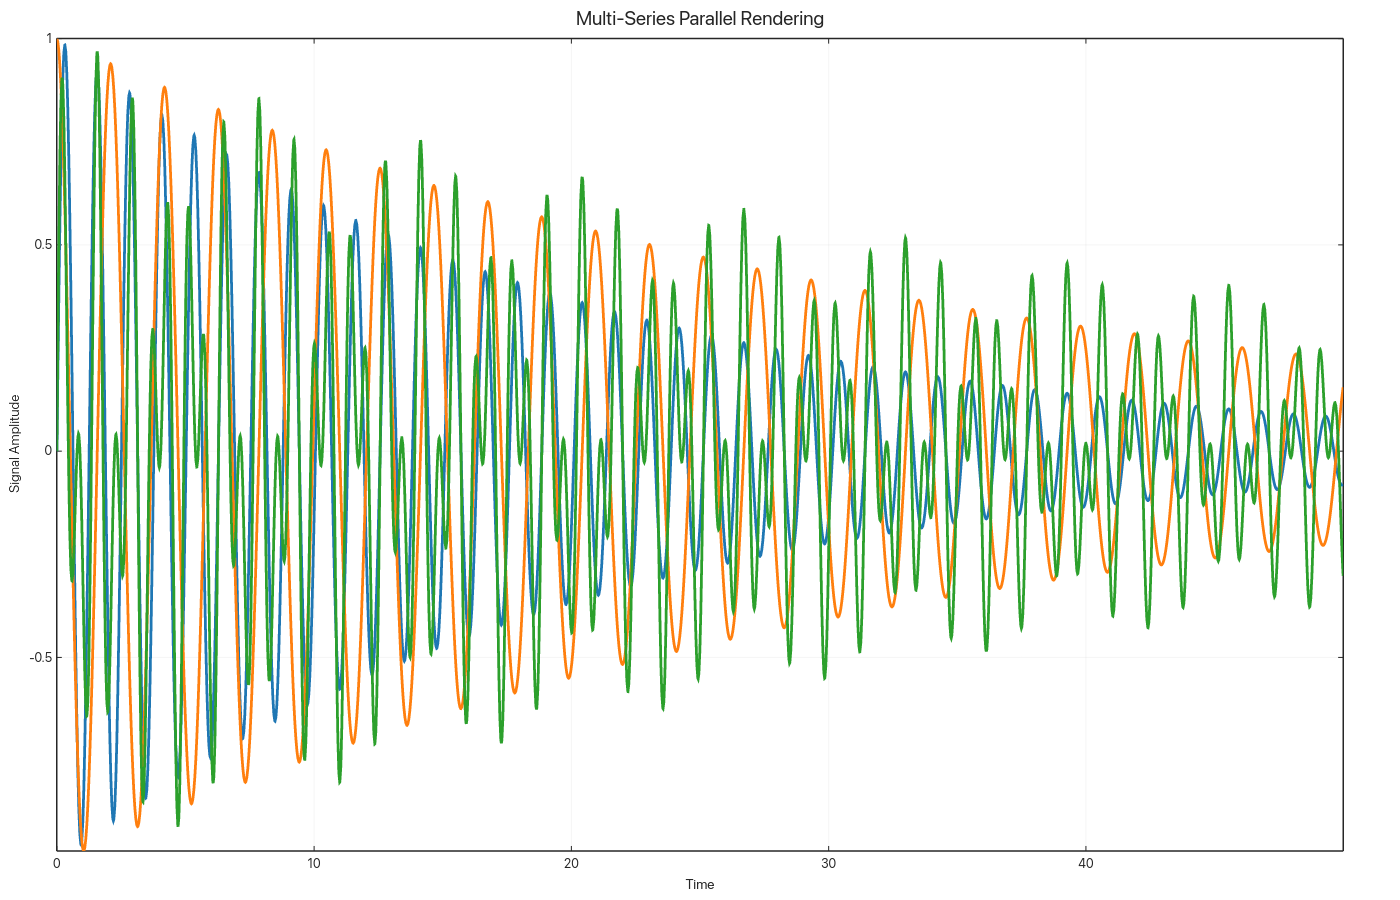 A ruviz performance gallery image with multiple large series.
GPUI Integration: ruviz-gpui
There is also a dedicated GPUI adapter crate: ruviz-gpui.
GPUI is the GPU-accelerated UI framework built by the Zed team. With ruviz-gpui, you can embed ruviz plots directly inside a native GPUI application.
[dependencies]
ruviz = "0.4.16"
ruviz-gpui = "0.4.16"
The adapter keeps ruviz plot construction and adds host-application behavior such as pan, zoom, hover, selection, context menus, PNG save, and clipboard copy. It supports macOS, Linux, and Windows.
This is useful for applications where notebook-style static output is not enough: instruments, signal monitors, trading dashboards, live demos, or any native tool where the plot needs to respond as part of the application UI.
How It Fits Against Other Rust Plotting Libraries
The Rust visualization ecosystem has become much more interesting recently. ruviz is not trying to replace every other option. charton and kuva are two projects that solve different problems.
charton
charton is a Polars-first plotting library with an Altair / Vega-Lite-inspired declarative API. It is a good fit if you want to describe what to plot through a layered grammar and keep Polars at the center of the workflow.
| Axis | charton | ruviz |
|---|---|---|
| API | Declarative, Altair / Vega-Lite style | matplotlib-like fluent builder |
| Focus | Polars-first data visualization | Shared rendering core across runtimes |
| Python integration | Bridge to Python visualization assets | Native PyO3 bindings |
| Browser | Positions itself as Wasm-ready | npm package with WASM distribution |
| Reactive updates | More static/declarative | Observable / Signal live updates |
charton is the better conceptual fit for people who want an Altair-like grammar in Rust. ruviz is aimed at cases where the same plot should move across Rust, Python, and JavaScript without switching renderers.
kuva
kuva is a scientific plotting library with a strong bioinformatics angle. It focuses on SVG output and includes specialized plots such as Manhattan plots, UpSet plots, phylogenetic trees, synteny diagrams, and volcano plots. It also has a CLI workflow for rendering directly from TSV/CSV files.
| Axis | kuva | ruviz |
|---|---|---|
| Main output | SVG-first, PNG/PDF behind features | PNG / SVG / PDF plus WASM canvas |
| Strength | Bioinformatics, CLI, terminal workflows | Notebooks, web, app embedding, live updates |
| Python | No | Yes |
| npm / WASM | No | Yes |
| GPU UI | No | ruviz-gpui |
kuva is sharply focused on Rust scientific pipelines and command-line workflows. ruviz is aimed more at notebook, browser, and application embedding use cases.
My rough mental map looks like this:
Low-level ←────────────────────────────────────────→ High-level

plotters        kuva              ruviz              charton
drawing API     CLI/SVG           cross-runtime       declarative layers
fine control    bioinformatics    reactive builder    Altair-style
These are not perfect substitutes. They solve different kinds of pain.
Installation
crates.io
Add ruviz = "0.4.16" to Cargo.toml. Optional features cover PDF, Typst math, animation, interactive windows, and performance paths.
Closing
Rust plotting now has real variety: low-level foundations like plotters, declarative systems like charton, domain-focused tools like kuva, and cross-runtime reactive libraries like ruviz. That is a good direction for the ecosystem.
ruviz is trying to make one thing practical: create the same figure from Rust, Python, or JavaScript; update it reactively when needed; and export it as a publication-grade static asset when the work is done.
If that direction sounds useful, a GitHub Star helps. Issues, PRs, and real use cases are also welcome.
use ruviz::prelude::*;

Plot::new()
    .line(&x, &y)
    .title("Happy Plotting in Rust")
    .save("hello_ruviz.png")?;